In this post iam just sharing the basics demonstration of power bi from downloading data from kaggle.com
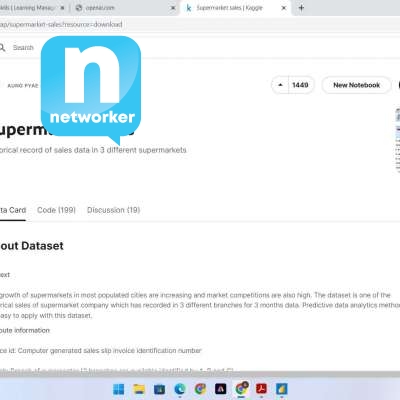
1) first i downloaded the dataset of ("SUPER MARKET SALES" from this website
https://www.kaggle.com/dataset....s/aungpyaeap/superma
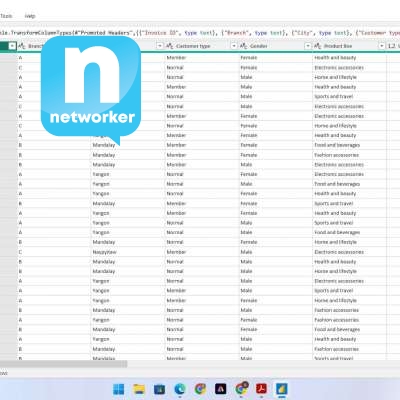
Then I loaded the data set in to power bi and click transfrom data
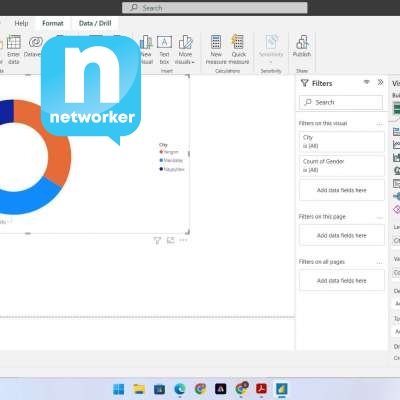
2) now I click on visualization icon and then created DONUT CHART and demonstrate the count of gender city wise
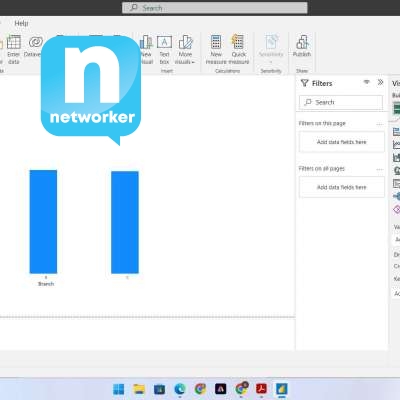
3) now I Created a Ribbon chart and show the count of payments by branch-wise
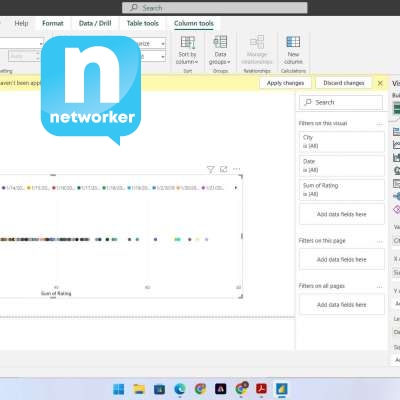
4) And finally I Created a Scatter chart and show ratings by city and Date
#powerbi #data #dataanalytist #datascience #datamining
כמו


תגובה
לַחֲלוֹק